Singapore ranks second in transport fare affordability
24 Oct 2018|1,632 views


A Nanyang Technological University study commissioned by the Public Transport Council (PTC) has found that Singapore's public transport fares ranked second most affordable among 12 major cities.
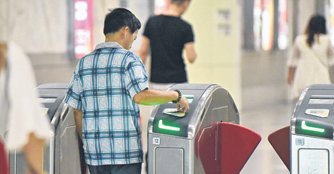
This is in line with PTC's monitoring of fare affordability for this category, seen as the group most likely to depend on public transport regularly.
Singapore had an index score of 4.8, meaning that, on average, a typical family that uses public transport daily here spends about 4.8% of its disposable income on public transport. San Francisco topped the list with a score of 4.1. Public transport expenditure in the American city is 28% higher than in Singapore but the disposable income is 48% higher.
Another finding from the study was that in terms of fare revenue collected per passenger kilometre, Singapore was the lowest among Hong Kong, Sydney, Toronto, New York, San Francisco and London. These seven cities were used as the relevant data was available only from this group.
In 2016, fare revenue per passenger kilometre in Singapore was S$0.11 for the entire public transport system. Hong Kong was second at S$0.14 and Sydney third at S$0.15. London was the highest at S$0.19, which meant for an average trip of 10km, Londoners paid at least S$0.80 more than commuters in Singapore.
A Nanyang Technological University study commissioned by the Public Transport Council (PTC) has found that Singapore's public transport fares ranked second most affordable among 12 major cities.
This is in line with PTC's monitoring of fare affordability for this category, seen as the group most likely to depend on public transport regularly.
Singapore had an index score of 4.8, meaning that, on average, a typical family that uses public transport daily here spends about 4.8% of its disposable income on public transport. San Francisco topped the list with a score of 4.1. Public transport expenditure in the American city is 28% higher than in Singapore but the disposable income is 48% higher.
Another finding from the study was that in terms of fare revenue collected per passenger kilometre, Singapore was the lowest among Hong Kong, Sydney, Toronto, New York, San Francisco and London. These seven cities were used as the relevant data was available only from this group.
In 2016, fare revenue per passenger kilometre in Singapore was S$0.11 for the entire public transport system. Hong Kong was second at S$0.14 and Sydney third at S$0.15. London was the highest at S$0.19, which meant for an average trip of 10km, Londoners paid at least S$0.80 more than commuters in Singapore.
Latest COE Prices
March 2026 | 1st BIDDING
NEXT TENDER: 18 Mar 2026
CAT A$108,220
CAT B$114,002
CAT C$76,000
CAT E$114,890
View Full Results 
Thank You For Your Subscription.


Tags
Products & Services
For Owners
Quick Links
About Sgcarmart
