Alongside the 2024 new car registration statistics that provide us a clear indicator of where the market is and how the various car brands are performing, the turn of the calendar also sees various other 2024 statistics being released by the Land Transport Authority (LTA) as well.
Here, we dig in to some of the other statistics to see what else we can learn about the automotive sector in 2024.
1. The car population has grown slightly
At the end of 2024, the total population of cars (not including taxis and tax-exempted vehicles) stood at 657,744 - 6,442 more than 2023 (about 1% more). That's a significantly larger increase compared to 2022 to 2023, where the total car population increased by just 635.
| Total Net Vehicle Population 2023 | New registration 2024 | De-registration 2024 | Total Net Vehicle Population as at 31 Dec 2024 | |
| Private cars | 524,613 | 31,857 | 6,129 | 524,418 (-0.04%) |
| Company cars | 35,429 | 2,162 | 25,070 | 34,510 (-2.6%) |
| Tuition cars | 770 | 18 | 55 | 741 (-3.8%) |
| Private-hire (Self-drive) cars | 28,306 | 3,829 | 1,177 | 31,012 (+9.6%) |
| Private-hire (Chauffeur) cars | 53,448 | 4,514 | 3,534 | 59,371 (+11.1%) |
| Off peak cars | 8,736 | 214 | 187 | 7,692 (-12%) |
| Total | 651,302 | 42,594 | 36,152 | 657,744 (+1%) |
However, that can be further segmented, and here we see that the private cars population has in fact shrank by 195.
And yet, when you dig a little deeper into the numbers, they don't seemingly add up. There were 31,857 new private car registrations this year, and just 6,129 de-registrations. This should have a net 25,728 increase, and yet the net private cars population that LTA states is 525,418 (decreasing by 195).
Having run through the numbers, it appears the likely explanation is a reclassification of cars across the different sub-categories. As the table caveats: "Figures are subjected to changes in usage type and licensing status". Looking at the numbers, what we can deduce is that many newly registered private cars (25,923) and some OPCs (1,071) totalling 26,994 have been reclassified into company cars (likely for fleet usage/leasing), tuition cars, as well as private hire cars during the year.
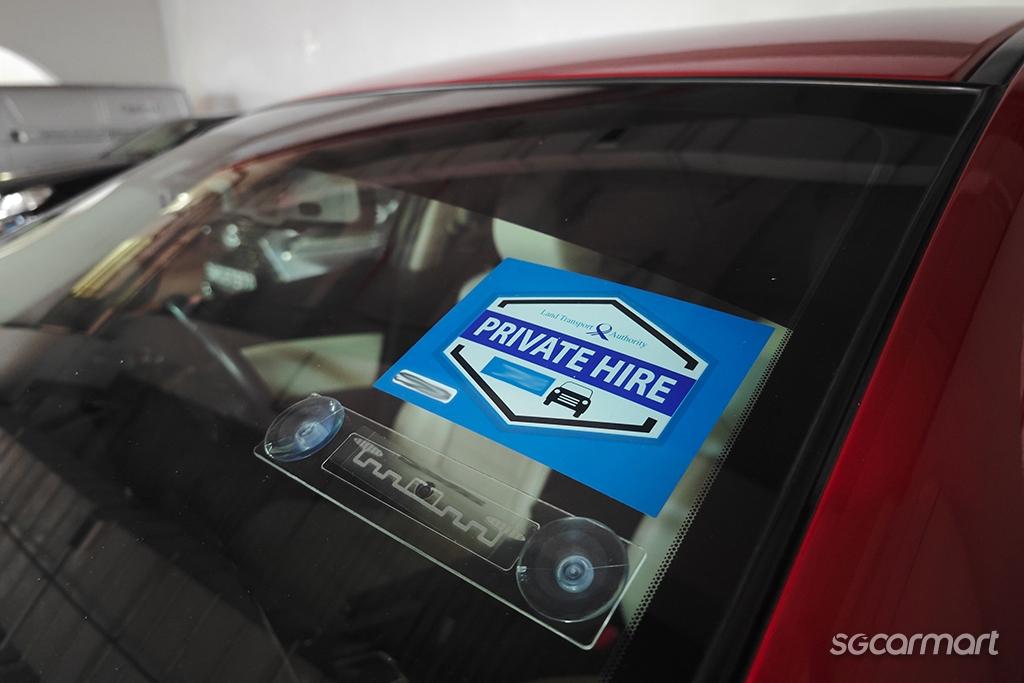
2. Private-hire has gone up, again
Growth is once again attributed to private hire cars, both self-driven and chauffeured. The private hire car population stands at 90,383 at the end of 2024. This marks an increase of 8,629 (+10.6%), which is a similar amount of growth as the previous year. With the recent announcement of two more ride-hail operators in 2025, it appears that private-hire vehicles will continue to be a growing fixture on our roads.
3. EVs have grown in market share
As of 31 Dec 2024, the total EV population is 26,225. That's a 120% increase year-on-year, so more than double. EVs now make up 4% of the cars on our roads, compared to 1.8% in 2023.
The category that continues to shrink is 'Petrol' (expectedly), falling by 26,662 (-5%). As we highlighted last year, many brands have transitioned into at least mild-hybrid offerings (which fall into the 'Petrol-Electric' category), which likely accounts for that drop. The number of 'Petrol-Electric' cars increased by 19,901 (+25%).
Petrol-Electric (Plug-in) has also gone up, and by a not-insignificant number of 197 (+14.5%). This could be aided by the increased availability of charging, though ultimately it still represents a small fraction of the total car population.
4. Diesels continue their phasing out
The total diesel car population fell by 1,262, or 7%. New registrations of diesel cars have ceased starting this year, so we should see the total diesel car population continue to fall year-on-year (though it'll be some time before diesels are fully off our roads). In 2024, just 42 new diesel cars were registered (and one diesel-electric).
Fun fact: There is currently one 'Diesel-Electric (Plug-in)' car in Singapore - a Mercedes-Benz SUV registered in 2022.
5. Taxi population continues to shrink
In a pattern that we've also plotted out previously, the taxi population continues to shrink. Year-on-year, the taxi population fell by 503 (-3.7%), and that's actually a slightly larger drop than from 2022 to 2023. This fall in taxi population appears to be happening in tandem with the private-hire population increasing - demonstrating a shift in user consumption patterns that the market is naturally adjusting for.
6. Motorbikes are up
One segment that saw notable growth was motorcycles. At 147,395, it's an increase of 3,907 (+2.7%), and also marks the highest the motorcycle population has been since 2013. Considering motorcycle COE premiums are still quite high (in the $9,000 range throughout 2024), this is perhaps a little surprising. With car COE premiums in the six-figures, motorists could also be opting for motorcycles as an alternative mode of private transport.
7. Commercial vehicles are down, buses are up
Likely driven in some part by the ETS, diesel 'Goods & Other Vehicles' have dropped by 2,832 (-2.2%). That has been replaced in part by petrol (+846) and electric (+1,229), but the total population still fell by 751.
Buses, however, have gone up, from 17,833 to 18,268, with growth in diesel, electric and diesel-electric (plug-in) categories.
8. 2024 saw significantly more COE revalidations
So far, LTA statistics are available only until Nov-24. But even that is enough to paint a clear picture. Where 2022 and 2023 saw 16,522 and 1,624 revalidations across all categories (A to D) respectively, 2024 had 25,244 revalidations in a 11-month period.
Zooming down into the car segments, Cat A and B both saw increased revalidations in both 5-year and 10-year COEs. Most notable are the 5-year renewals. Cat A had 2,774 through November, which is close to triple the 1,007 in 2023. For Cat B, the 1,082 5-year revalidations is more than double 2023's 477.
In this high COE climate, it appears that many more people are choosing to renew. How this will eventually play out, given LTA's now cut-and-fill approach (which is contingent on these 5-year COE renewals), we will have to wait and see.
9. De-registrations are also up
Here's an interesting one - de-registrations also increased in 2024. Total de-registrations went up by 4,971 (10%). This is driven is large part by Cat A cars, with de-registrations going up by a whopping 4,602 (27.2%). Cat B de-registrations also increased by 2,446 (20%). Cat C and taxis also had slightly increased de-registrations, but Cat D saw a significant drop in de-registrations (down 2,682 or 24%).
With the total car population not changing much, this means that most of these deregistered vehicles are effectively replaced with a new one. This, combined with higher revalidations, can help to explain the consistent persistence of demand, which then leads to persistent upward pressure on COE premiums.
10. More used cars being transacted
Based on the number of vehicles being transferred, there were 102,140 cars transferred in 2024, 7,064 (+7.4%) more than 2023. All other categories (motorcycles, goods & other vehicles, buses) fell.
Digging into a bit more detail, the most transferred brands in 2024 were Toyota (20,650), followed by Honda (14,940) and Mercedes-Benz (12,540). No surprises there - these are arguably still the 3 most established brands in the used market.
Of course, these numbers tell an incomplete story. For example, a car could have been transferred multiple times within a year. Additionally, the statistics do not tell us if the vehicles were transferred to another owner, or to a car dealer. But, it does show greater movement within the used car market.

11. New OPC registrations were up, but overall OPC population still shrank
Here's another interesting one. The number of new OPCs registered were up in 2024 compared to the two previous years (214 compared to 149 in 2023 and 189 in 2022), but the overall population still shrank by about 12%. And in fact, the population of OPCs has been steadily shrinking month-on-month since Jan 2022. Here's a good explainer on why.

12. Total vehicle population has grown once more
When adding it all up, we've crossed the million mark. There are 1,007,094 vehicles on the road across all categories (1% increase) - with increases across Cat A and Cat B cars, Cat D motorcycles, as well as VQS-exempted vehicles. In 2024, the two biggest contributors to the increase in vehicle population have been private-hire cars, as well as motorcycles. Cue the pitchforks.