COE Analysis Dec '25: More of the same ($100k COEs)?
02 Jan 2026|14,126 views


COE price trend over the past quarter: October to December vs July to September
Grief may seem an odd concept to bring up when discussing car-buying in Singapore.
But as we look back on the year, you'd be hard-pressed not to wonder if Singaporean motorists, as a collective entity, have already passed through the proverbial seven stages: No more shock; far less anger and denial. Just placid acceptance.
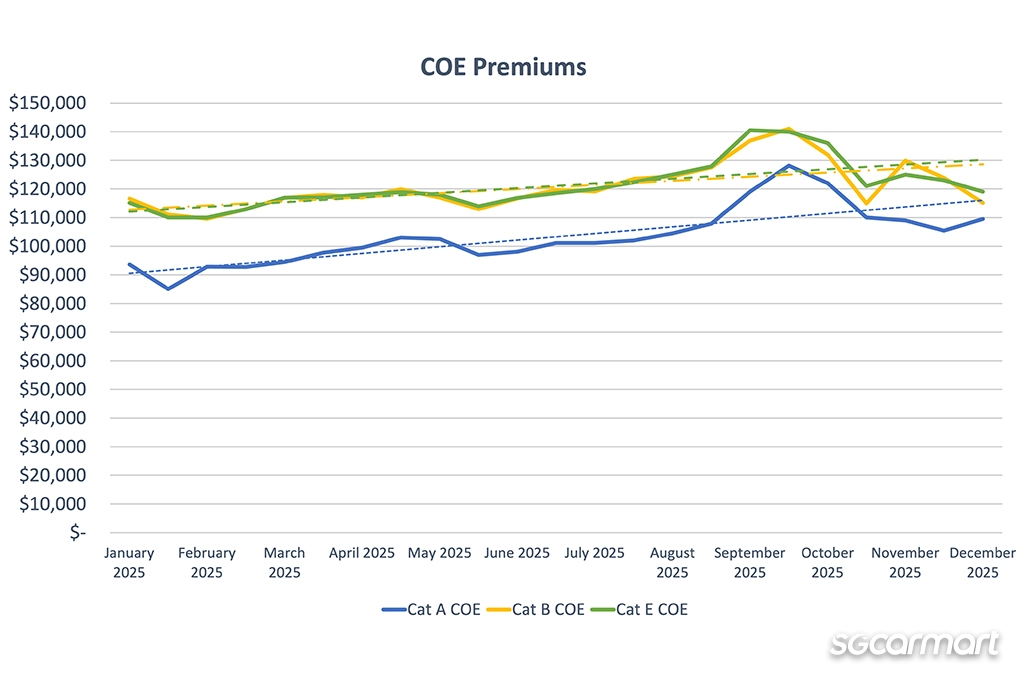
The trendlines for COE premiums in all passenger car categories are still worryingly positive - with Cat A being the most significant
Before we take a step back to behold 2025 in its entirety, though, a closer-view recount of the past quarter, as always, is in order.
When averaged out over October to December, COE premiums rose across all three passenger car categories when compared against the previous period spanning July to September.
Those who have been paying attention to the market should be unsurprised to note that Category A, typically reserved for less powerful mass market models, led the rise. It posted a relatively sharp 7.6% quarter on quarter increase.
Premiums in Cat A over the last quarter of the year posted a 7.6% increase over the previous one. As of the final bidding round of the year, Cat A premiums stood at 7.0% above their 12-month trailing average
On the other hand, the open Category E saw a gentler increase of just 1.3%, whereas Category B - for larger and more powerful cars - saw premiums rising by a mere 0.8% in the same period.
On that note, it’s worth pointing out that at the time of writing this, the gap in premiums between Cat A and Cat B has narrowed to less than $6,000 (based on the second bidding round of December 2025). We noted in our coverage of the bidding round then that Cat A premiums stood at 7.0% above their 12-month trailing average.
Now that we can look back on the whole year, also worth pointing out is that COE premiums have generally trended higher across 2025. While scaling greater peaks, they also never dipped to the sorts of lows seen in 2024.
| Cat A | Cat B | Cat E | |
| Lowest point in 2024 | $65,010 (Jan) | $85,010 (Jan) | $94,006 (Feb) |
| Highest point in 2024 | $103,799 (Oct) | $116,002 (Oct) | $116,000 (Oct) |
| Lowest point in 2025 | $85,000 (Feb) | $109,558 (Feb) | $110,000 (Feb) |
| Highest point in 2025 | $128,105 (Oct) | $141,000 (Oct) | $140,502 (Oct) |
As we've discussed to virtually no end, there are a multitude of reasons as to why the market is in the state where it is right now. These span everything from the influx of new brands to a maturing EV market.
But in retrospect, the fact that premiums continued their ascent so steadily in 2025 is perhaps surprising for one very big reason: The fact that COE supply this year has been on a constant rise (in other words, more certificates have been up for bidding with each successive quota period than the one before).
As we often emphasise, the trendlines that we observe in the COE market are still fundamentally influenced by two forces: Supply and demand. That premiums have continued their upwards trajectory in parallel to the increased number of certificates (and not in spite of it) illuminates the stark reality that car-buying demand has generally held strong too.
The fact that COE prices have not tumbled despite the increased quota pool points to the stark reality that car-buying demand has held strong across the year
By a different token, however, what is perhaps even more surprising is the observation that general furore surrounding COE premiums - outside of motoring journalist circles and the terminally online crowd, that is - hasn't appeared to have grown in tandem.
In fact, after some debate, and a not-insignificant number of policy tweaks over the last two years, parliament also seems to have dropped the idea of making further tweaks. (Besides, the spotlight on COEs appears to have been ceded to discourse around public transport infrastructure of late.)
It's a probable sign of fatigue; a possible consequence of how protracted the discourse around sky-high COE premiums has been, since the reality does not change anyway. $180,000 may sound like a ridiculous sum to pay for a family car, those who can afford it have nonetheless simply and silently gone ahead to get one (demand would have cooled off otherwise).

Car de-registrations over the last 12 months
The calculation methodology for impending COE quota supply periods has evolved so much over the past two years that rehashing it in full would probably require a story of its own.
Regardless, returning to the de-registration data is helpful because certificates freed up from de-registered cars still constitute the bulk of the COE supply pool. Before all those supplementary measures were introduced, the LTA used a 12-month rolling average of vehicle de-registrations to help determine supply for the next three-month period.
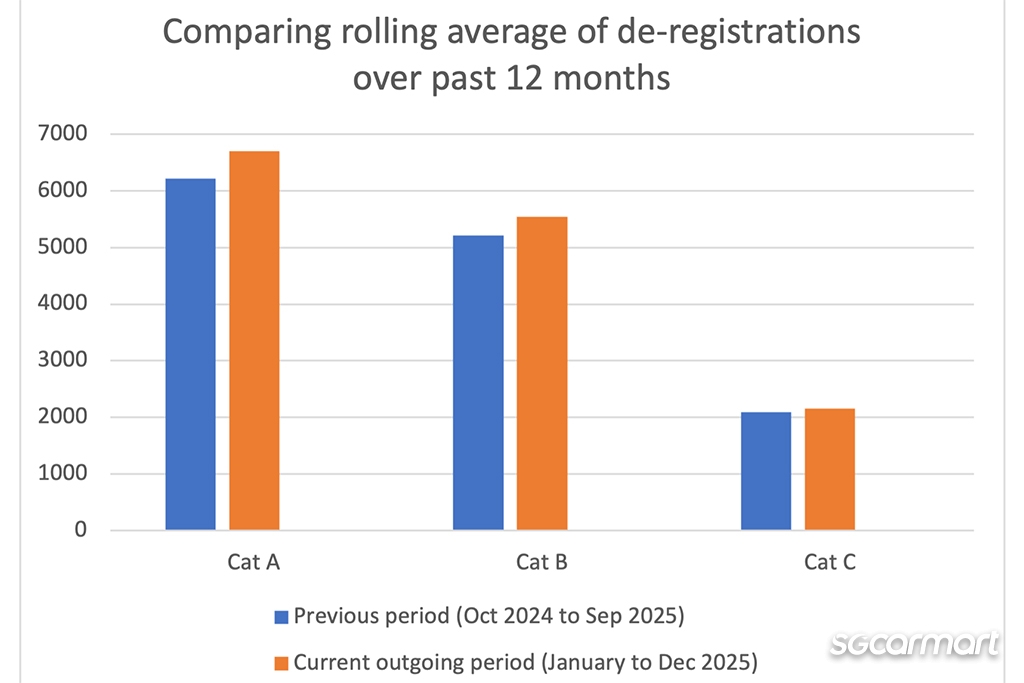
De-registrations in Cat A are projected to increase the most, by 7.0%
Data extrapolated from the 11 months spanning January to November 2025 indicates that the overall rolling average of de-registrations for will be 6.5% higher than that of the previous 12-month period (October 2024 to September 2025).
Cat A is projected to lead the charge with a 7.7% increase, while Cat B is set to trail just behind with a 6.3% increase. Meanwhile, de-registrations in Cat C (for commercial vehicles) are projected to move upwards more gently, by 3.3%.
Should car-buying demand continue to hold at the rate that we saw in 2025, the market is unlikely to witness a significant drop-off in COE premiums
While the LTA has guaranteed that COE supply will continue to increase until it reaches its expected peak in 2026, there are again a couple of things that need to be pointed out at this juncture.
Both of which may unfortunately inspire more fear than confidence about what is to come for folks seeking to buy a car.
Firstly, the LTA has only been clear about the fact that the COE supply will continue to increase; it hasn't, however, given itself a baseline figure for how much it has to increase by.
Given that the opacity of the supplementary measures has made projecting into the future a fruitless task, we can only base our prognoses on past data. And in turn, you’ll note that the quarter-over-quarter increases have started to slow over time.
| Period | Total quota for period | Percentage increase over previous period |
| Feb to Apr 2025 | 17,133 | +8.0% |
| May to July 2025 | 18,232 | +6.4% |
| Aug to Oct 2025 | 18,701 | +2.6% |
| Nov 2025 to Jan 2026 | 18,984 | +1.5% |
Should this trend of diminishing increases hold without demand receding, expecting COE premiums to fall would be a fool's errand.
In case you missed it, the LTA's previous press release announcing the COE quota for the current period (spanning November 2025 to January 2026) also included this ominous caveat: "COE supply for Category A is expected to peak and even out supply in this and the coming quarters."
In other words, don't expect a huge outpouring of certs - at least not the sort that could send premiums plummeting. That's a worrying prospect, especially when it applies to what should be the most affordable category of COEs - and when said category is still comfortably above the $100,000 line.
2026 is expected to be the year when COE supply starts to peak
All that brings us to the second point. As we now close the year out, it may be easy to miss the fact that we are also now coming face to face with the proverbial peak COE supply period beginning in 2026. (Interestingly, data from 2016 indicates that the months of June and July received the highest COE quota for the year - a possible indication of how 2026 might play out.)
You'd thus also expect that premiums to be at the start of a steady decline now, yet this is still the current state of the market we've found ourselves in - where all COE categories are hovering comfortably above $100,000.
If anything, the single biggest takeaway from 2025 we've gathered is that a consistently increasing COE supply isn't a silver bullet for lower premiums. As such, as we head into the new year, being hesitant with our hope for cheaper cars would only be prudent.
Furthermore, when it first introduced the 'cut-and-fill' approach to supplement COE quota, the authorities had already warned that just as the expected troughs in supply would not be as low as we had experienced in the past, so too would the expected supply peaks no longer reach their previous highs. The logical consequence of this? Again, don't expect premiums to drop to the same 'affordable' levels we've witnessed in the past.
New car pricing: October to December 2025
Sgcarmart does its best to use a pool of popular models from authorised dealers to analyse the general price trends of new cars.
In step with the rise in COE premiums over the past quarter, the group of models we monitor reflected a higher 2.4% increase in new car prices in the last quarter of the year, against the three-month average over Q3 2025.
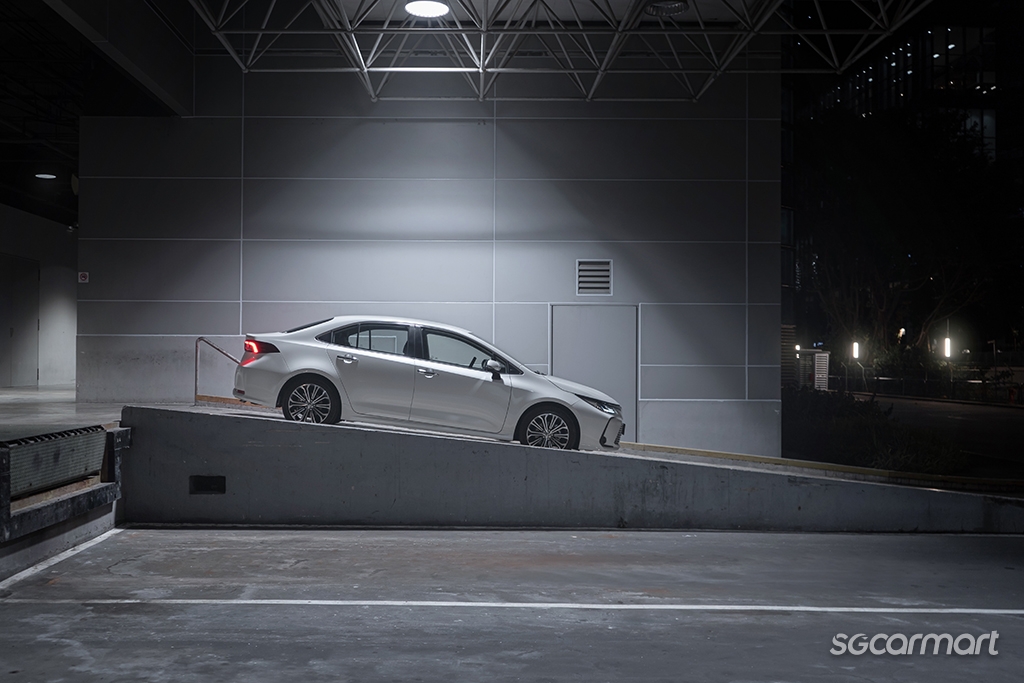
October saw a number of Singapore's bestselling family cars either come dangerously close to the $200,000 line, or cross it properly (Pictured: Toyota Corolla Altis Elegance)
Unsurprisingly, most cars saw their list prices hit eye-watering highs in October (when Cat A hit its all-time high). In our previous analysis, we noted that it would be rather depressing to live in a reality where bread-and-butter cars like the Toyota Corolla Altis were selling for more than $200,000 - and across the two bidding rounds of October, that was exactly what transpired.
Thankfully, premiums then declined across November through to the first bidding session of December - but worryingly picked up steam again in the month’s second session.
Looking ahead, the shadow of January’s Singapore Motor Show looms large, given the influx of orders that are usually placed over the Show weekend. Traditionally, while premiums tend to soften in January and February, they also accelerate northwards again as dealers race to fulfil post-Show orders and also secure deliveries before Chinese New Year hits.
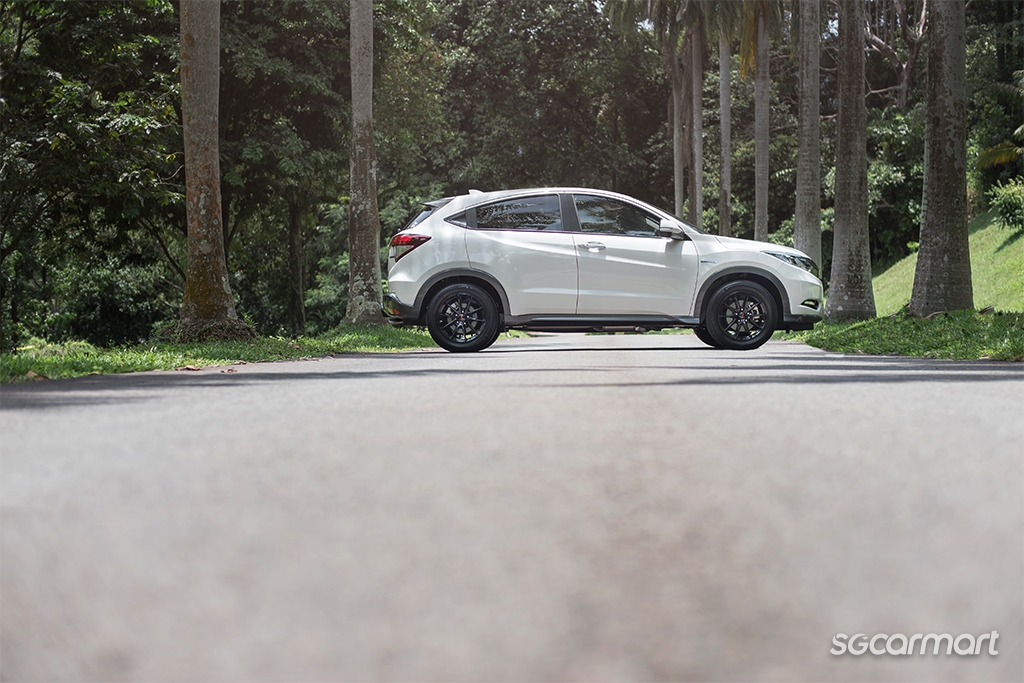
Fluctuations in used car prices still appear to be mirroring movements in the new car market (Pictured: Honda Vezel)
Most popular used cars: September to November 2025
Over the three-month period between September to November 2025, these were the five most listed used cars on Sgcarmart.
| Car model | Year of registration | Average annual depreciation (approx.) |
| Honda Vezel 1.5A X | 2016 | $12,948/yr |
| Honda Civic 1.6A VTi | 2018 | $15,920/yr |
| Nissan Qashqai 1.2A DIG-T | 2017 | $12,841/yr |
| Mercedes-Benz C-Class C180 Avantgarde | 2017 | $19,625/yr |
| Subaru Forester 2.0i-L Sunroof | 2018 | $15,399/yr |
Perhaps unsurprisingly, the annual depreciation figures of these popular used car models logged notable increases for both September and October, before sliding in November - moving perfectly in step with the way COE premiums trended across the three months.
We previously postulated that this quarter would help shed light on whether used car dealers were closely matching fluctuations in COE premiums, or whether they were resolutely keeping prices down to bring footfall into their showroom lots. For now at least, the former seems to be holding true still.
Here's a recount of our past three COE analyses!
COE Analysis Oct '25: Premiums sizzle as 2026 looms over
COE price trend over the past quarter: October to December vs July to September
Grief may seem an odd concept to bring up when discussing car-buying in Singapore.
But as we look back on the year, you'd be hard-pressed not to wonder if Singaporean motorists, as a collective entity, have already passed through the proverbial seven stages: No more shock; far less anger and denial. Just placid acceptance.
The trendlines for COE premiums in all passenger car categories are still worryingly positive - with Cat A being the most significant
Before we take a step back to behold 2025 in its entirety, though, a closer-view recount of the past quarter, as always, is in order.
When averaged out over October to December, COE premiums rose across all three passenger car categories when compared against the previous period spanning July to September.
Those who have been paying attention to the market should be unsurprised to note that Category A, typically reserved for less powerful mass market models, led the rise. It posted a relatively sharp 7.6% quarter on quarter increase.
Premiums in Cat A over the last quarter of the year posted a 7.6% increase over the previous one. As of the final bidding round of the year, Cat A premiums stood at 7.0% above their 12-month trailing average
On the other hand, the open Category E saw a gentler increase of just 1.3%, whereas Category B - for larger and more powerful cars - saw premiums rising by a mere 0.8% in the same period.
On that note, it’s worth pointing out that at the time of writing this, the gap in premiums between Cat A and Cat B has narrowed to less than $6,000 (based on the second bidding round of December 2025). We noted in our coverage of the bidding round then that Cat A premiums stood at 7.0% above their 12-month trailing average.
Now that we can look back on the whole year, also worth pointing out is that COE premiums have generally trended higher across 2025. While scaling greater peaks, they also never dipped to the sorts of lows seen in 2024.
| Cat A | Cat B | Cat E | |
| Lowest point in 2024 | $65,010 (Jan) | $85,010 (Jan) | $94,006 (Feb) |
| Highest point in 2024 | $103,799 (Oct) | $116,002 (Oct) | $116,000 (Oct) |
| Lowest point in 2025 | $85,000 (Feb) | $109,558 (Feb) | $110,000 (Feb) |
| Highest point in 2025 | $128,105 (Oct) | $141,000 (Oct) | $140,502 (Oct) |
As we've discussed to virtually no end, there are a multitude of reasons as to why the market is in the state where it is right now. These span everything from the influx of new brands to a maturing EV market.
But in retrospect, the fact that premiums continued their ascent so steadily in 2025 is perhaps surprising for one very big reason: The fact that COE supply this year has been on a constant rise (in other words, more certificates have been up for bidding with each successive quota period than the one before).
As we often emphasise, the trendlines that we observe in the COE market are still fundamentally influenced by two forces: Supply and demand. That premiums have continued their upwards trajectory in parallel to the increased number of certificates (and not in spite of it) illuminates the stark reality that car-buying demand has generally held strong too.
The fact that COE prices have not tumbled despite the increased quota pool points to the stark reality that car-buying demand has held strong across the year
By a different token, however, what is perhaps even more surprising is the observation that general furore surrounding COE premiums - outside of motoring journalist circles and the terminally online crowd, that is - hasn't appeared to have grown in tandem.
In fact, after some debate, and a not-insignificant number of policy tweaks over the last two years, parliament also seems to have dropped the idea of making further tweaks. (Besides, the spotlight on COEs appears to have been ceded to discourse around public transport infrastructure of late.)
It's a probable sign of fatigue; a possible consequence of how protracted the discourse around sky-high COE premiums has been, since the reality does not change anyway. $180,000 may sound like a ridiculous sum to pay for a family car, those who can afford it have nonetheless simply and silently gone ahead to get one (demand would have cooled off otherwise).
Car de-registrations over the last 12 months
The calculation methodology for impending COE quota supply periods has evolved so much over the past two years that rehashing it in full would probably require a story of its own.
Regardless, returning to the de-registration data is helpful because certificates freed up from de-registered cars still constitute the bulk of the COE supply pool. Before all those supplementary measures were introduced, the LTA used a 12-month rolling average of vehicle de-registrations to help determine supply for the next three-month period.
De-registrations in Cat A are projected to increase the most, by 7.0%
Data extrapolated from the 11 months spanning January to November 2025 indicates that the overall rolling average of de-registrations for will be 6.5% higher than that of the previous 12-month period (October 2024 to September 2025).
Cat A is projected to lead the charge with a 7.7% increase, while Cat B is set to trail just behind with a 6.3% increase. Meanwhile, de-registrations in Cat C (for commercial vehicles) are projected to move upwards more gently, by 3.3%.
Should car-buying demand continue to hold at the rate that we saw in 2025, the market is unlikely to witness a significant drop-off in COE premiums
While the LTA has guaranteed that COE supply will continue to increase until it reaches its expected peak in 2026, there are again a couple of things that need to be pointed out at this juncture.
Both of which may unfortunately inspire more fear than confidence about what is to come for folks seeking to buy a car.
Firstly, the LTA has only been clear about the fact that the COE supply will continue to increase; it hasn't, however, given itself a baseline figure for how much it has to increase by.
Given that the opacity of the supplementary measures has made projecting into the future a fruitless task, we can only base our prognoses on past data. And in turn, you’ll note that the quarter-over-quarter increases have started to slow over time.
| Period | Total quota for period | Percentage increase over previous period |
| Feb to Apr 2025 | 17,133 | +8.0% |
| May to July 2025 | 18,232 | +6.4% |
| Aug to Oct 2025 | 18,701 | +2.6% |
| Nov 2025 to Jan 2026 | 18,984 | +1.5% |
Should this trend of diminishing increases hold without demand receding, expecting COE premiums to fall would be a fool's errand.
In case you missed it, the LTA's previous press release announcing the COE quota for the current period (spanning November 2025 to January 2026) also included this ominous caveat: "COE supply for Category A is expected to peak and even out supply in this and the coming quarters."
In other words, don't expect a huge outpouring of certs - at least not the sort that could send premiums plummeting. That's a worrying prospect, especially when it applies to what should be the most affordable category of COEs - and when said category is still comfortably above the $100,000 line.
2026 is expected to be the year when COE supply starts to peak
All that brings us to the second point. As we now close the year out, it may be easy to miss the fact that we are also now coming face to face with the proverbial peak COE supply period beginning in 2026. (Interestingly, data from 2016 indicates that the months of June and July received the highest COE quota for the year - a possible indication of how 2026 might play out.)
You'd thus also expect that premiums to be at the start of a steady decline now, yet this is still the current state of the market we've found ourselves in - where all COE categories are hovering comfortably above $100,000.
If anything, the single biggest takeaway from 2025 we've gathered is that a consistently increasing COE supply isn't a silver bullet for lower premiums. As such, as we head into the new year, being hesitant with our hope for cheaper cars would only be prudent.
Furthermore, when it first introduced the 'cut-and-fill' approach to supplement COE quota, the authorities had already warned that just as the expected troughs in supply would not be as low as we had experienced in the past, so too would the expected supply peaks no longer reach their previous highs. The logical consequence of this? Again, don't expect premiums to drop to the same 'affordable' levels we've witnessed in the past.
New car pricing: October to December 2025
Sgcarmart does its best to use a pool of popular models from authorised dealers to analyse the general price trends of new cars.
In step with the rise in COE premiums over the past quarter, the group of models we monitor reflected a higher 2.4% increase in new car prices in the last quarter of the year, against the three-month average over Q3 2025.
October saw a number of Singapore's bestselling family cars either come dangerously close to the $200,000 line, or cross it properly (Pictured: Toyota Corolla Altis Elegance)
Unsurprisingly, most cars saw their list prices hit eye-watering highs in October (when Cat A hit its all-time high). In our previous analysis, we noted that it would be rather depressing to live in a reality where bread-and-butter cars like the Toyota Corolla Altis were selling for more than $200,000 - and across the two bidding rounds of October, that was exactly what transpired.
Thankfully, premiums then declined across November through to the first bidding session of December - but worryingly picked up steam again in the month’s second session.
Looking ahead, the shadow of January’s Singapore Motor Show looms large, given the influx of orders that are usually placed over the Show weekend. Traditionally, while premiums tend to soften in January and February, they also accelerate northwards again as dealers race to fulfil post-Show orders and also secure deliveries before Chinese New Year hits.
Fluctuations in used car prices still appear to be mirroring movements in the new car market (Pictured: Honda Vezel)
Most popular used cars: September to November 2025
Over the three-month period between September to November 2025, these were the five most listed used cars on Sgcarmart.
| Car model | Year of registration | Average annual depreciation (approx.) |
| Honda Vezel 1.5A X | 2016 | $12,948/yr |
| Honda Civic 1.6A VTi | 2018 | $15,920/yr |
| Nissan Qashqai 1.2A DIG-T | 2017 | $12,841/yr |
| Mercedes-Benz C-Class C180 Avantgarde | 2017 | $19,625/yr |
| Subaru Forester 2.0i-L Sunroof | 2018 | $15,399/yr |
Perhaps unsurprisingly, the annual depreciation figures of these popular used car models logged notable increases for both September and October, before sliding in November - moving perfectly in step with the way COE premiums trended across the three months.
We previously postulated that this quarter would help shed light on whether used car dealers were closely matching fluctuations in COE premiums, or whether they were resolutely keeping prices down to bring footfall into their showroom lots. For now at least, the former seems to be holding true still.
Here's a recount of our past three COE analyses!
COE Analysis Oct '25: Premiums sizzle as 2026 looms over


Thank You For Your Subscription.


Tags
Products & Services
For Owners
Quick Links
About Sgcarmart
